A1c Levels Chart: Normal Range and What Counts as a Good A1c
Below 5.7% is normal, 6.5% is the diabetes threshold, and under 7% is the usual target once you have a diagnosis. Here is the full chart, and the four situations where A1c misleads.
Written from lived experience, not clinical training, and checked against the clinical guidance listed below. Not yet reviewed by a named clinician.
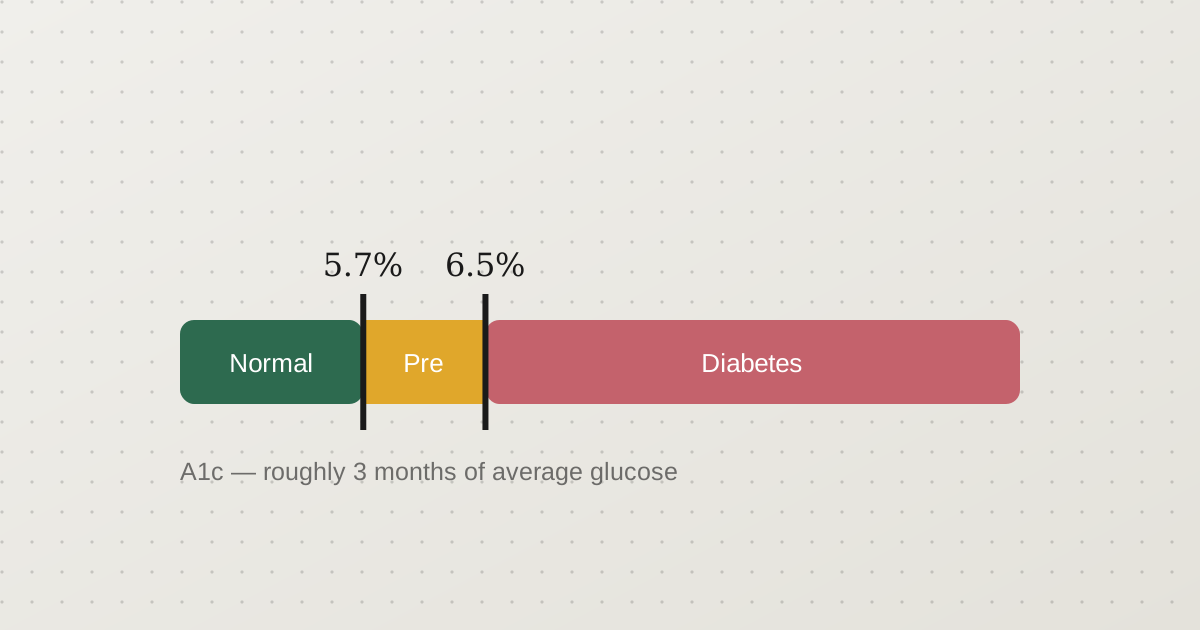
A1c is the closest thing diabetes care has to a single headline number. It needs no fasting, no single bad morning can distort it, and it is what most treatment decisions are anchored to.
It is also routinely over-interpreted. This guide covers the full chart, what a good target actually is, and the four situations where the number should not be trusted at face value.
The A1c chart
| A1c | Average glucose (mg/dL) | Average glucose (mmol/L) | Category |
|---|---|---|---|
| 5.0% | 97 | 5.4 | Normal |
| 5.5% | 111 | 6.2 | Normal |
| 5.7% | 117 | 6.5 | Prediabetes begins |
| 6.0% | 126 | 7.0 | Prediabetes |
| 6.5% | 140 | 7.8 | Diabetes threshold |
| 7.0% | 154 | 8.6 | Common adult target |
| 7.5% | 169 | 9.4 | Above target |
| 8.0% | 183 | 10.2 | Above target |
| 9.0% | 212 | 11.8 | Well above target |
| 10.0% | 240 | 13.4 | High complication risk |
| 11.0% | 269 | 14.9 | Very high risk |
| 12.0% | 298 | 16.5 | Very high risk |
The conversion is eAG (mg/dL) = (28.7 × A1c) − 46.7. For mmol/L, divide by 18.
Diagnosis normally needs two abnormal results — either two separate tests, or two different tests from the same blood draw.
What the test actually measures
Glucose in your bloodstream attaches to hemoglobin in red blood cells. The higher the glucose and the longer the exposure, the more hemoglobin gets glycated. A1c reports the percentage that has.
Because red cells live roughly three months, the result is a rolling average over that period — but it is not evenly weighted. Around half the value comes from the most recent 30 days, with the earlier weeks contributing progressively less. That matters practically: a good month before a test does move the number, and a bad fortnight shows up.
What counts as a good A1c
For someone without diabetes: below 5.7%.
For someone with diabetes, the general adult target is below 7%, but this is one of the more individualised numbers in medicine.
Tighter than 7% (often 6.5%) may be appropriate for someone recently diagnosed, younger, without cardiovascular disease, and on medication that does not cause hypoglycemia. The logic is that early tight control produces long-lasting benefit — the "legacy effect" observed in long-term follow-up of major trials.
Looser than 7% (7.5% or 8%) is appropriate more often than people expect: older adults, limited life expectancy, established cardiovascular disease, advanced complications, a history of severe hypoglycemia, or hypoglycemia unawareness. For those people, a low reading is the greater danger, and pushing toward 6.5% causes harm rather than preventing it.
If you do not know your personal target, that is a good and specific question for your next appointment. "What A1c are we aiming for, and why that number for me?"
The blind spot: variability
This is the most important limitation and the least discussed.
A1c cannot show variability. A steady 154 mg/dL all day and a sawtooth swinging between 60 and 250 both produce an A1c of about 7%. The second carries more risk, feels considerably worse, and involves regular hypoglycemia — and the A1c looks identical.
This is why continuous glucose monitoring reports time in range alongside the average. The usual target is more than 70% of readings between 70 and 180 mg/dL (3.9–10.0 mmol/L), with less than 4% below 70.
If your A1c looks acceptable but you feel unstable, that gap is worth raising rather than dismissing. It is a good reason to ask about CGM.
When A1c is unreliable
The test assumes red blood cells survive their normal lifespan. Where they do not, the result distorts — and it can distort in either direction.
Falsely low A1c — cells are replaced faster, so less time to glycate:
- Anemia from hemolysis, or recent blood loss
- Recent transfusion
- Pregnancy, particularly the second and third trimesters
- Erythropoietin treatment
- Advanced liver disease
Falsely high A1c — cells survive longer, or the assay is confused:
- Iron-deficiency and vitamin B12-deficiency anemia
- Chronic kidney disease and uremia
- Splenectomy
Unpredictable — sickle cell trait, thalassemia and other hemoglobin variants can interfere with the assay itself, depending on the method the lab uses.
In these situations fructosamine, a glucose tolerance test, or continuous monitoring may be used instead. If your A1c and your meter persistently disagree, say so — that mismatch is data, not a nuisance.
There is also normal biological variation. Some people glycate hemoglobin faster than others for the same glucose exposure — a so-called glycation gap. Two people with identical average glucose can genuinely return A1c results differing by several tenths of a percent.
Why your meter average may not match
It is common for the estimated average from an A1c to disagree with the average on your meter, and the meter is usually the misleading one.
The reason is simple: you do not test at random. Most people test fasting, before meals, or when they suspect something is wrong. That systematically under-samples the post-meal peaks and pulls the meter average down. A CGM, which samples every few minutes, generally agrees with A1c far more closely.
A1c in mmol/mol
Outside the US, A1c is usually reported in mmol/mol rather than as a percentage — the IFCC unit. The two describe the same thing on different scales, and lab reports increasingly show both.
| A1c (%) | mmol/mol |
|---|---|
| 5.0 | 31 |
| 5.7 | 39 |
| 6.0 | 42 |
| 6.5 | 48 |
| 7.0 | 53 |
| 8.0 | 64 |
| 9.0 | 75 |
| 10.0 | 86 |
The conversion is mmol/mol = (A1c% − 2.15) × 10.929. The key landmarks are 39 for prediabetes, 48 for diabetes and 53 for the usual adult target.
What a change of 1% actually means
A single percentage point sounds small and is not. Moving from 8% to 7% takes average glucose from roughly 183 mg/dL to 154 mg/dL — about 29 mg/dL off every reading, all day, every day.
In long-term follow-up of major trials, each 1% reduction in A1c was associated with a substantial fall in the risk of small-vessel complications: retinopathy, kidney disease and neuropathy. The relationship is continuous rather than a threshold, which means improvement is worth having even if you do not reach target.
That is worth holding onto when a target feels out of reach. Going from 9% to 8% is not a failure to reach 7%; it is a meaningful reduction in risk in its own right.
How often to test
- No diabetes, no risk factors: every three years from age 35
- Prediabetes: annually at minimum
- Diabetes, at target and stable: twice a year
- Diabetes, above target or after a treatment change: every three months
Three months is the interval because it takes that long for a change to be fully reflected. Testing at six weeks after a medication change shows part of the effect, which is sometimes useful and sometimes misleading.
What actually moves it
The same things that move daily readings, sustained long enough to shift an average: post-meal walking, meal composition and order, added fibre, protected sleep, and prescribed medication taken consistently. Our guide to lowering blood sugar covers what holds up in trials and what does not.
For context on the daily numbers behind the average, see the full blood sugar levels chart. And needing medication added over time is the expected course of type 2 diabetes rather than a personal failure — a rising A1c is information about the disease, not a verdict on your effort.
Frequently asked questions
What is a normal A1c level?
Below 5.7% is normal, which corresponds to an average glucose of roughly 117 mg/dL (6.5 mmol/L) or less. From 5.7% to 6.4% indicates prediabetes, and 6.5% or above on two separate tests indicates diabetes.
What is a good A1c level for someone with diabetes?
Below 7% is the general adult target, corresponding to an average glucose of about 154 mg/dL. Targets are individualised — a fit younger adult may be given 6.5%, while an older adult with heart disease and a history of falls may deliberately be set at 8%, because for them a hypo is the greater danger.
How do I convert A1c to average blood sugar?
Multiply the A1c by 28.7 and subtract 46.7 for mg/dL. An A1c of 7% works out to 154 mg/dL, or 8.6 mmol/L. To convert mg/dL to mmol/L, divide by 18.
How quickly can A1c change?
A1c reflects roughly the previous two to three months, weighted toward the most recent weeks — about half of the value comes from the last 30 days. Meaningful change usually shows within 6 to 12 weeks, which is why repeat testing is typically scheduled at three months.
Can an A1c result be wrong?
It can be misleading rather than wrong. Anemia, recent blood loss or transfusion, chronic kidney disease, pregnancy, sickle cell trait and other hemoglobin variants all affect red cell lifespan and distort the result. If your A1c and your home readings persistently disagree, that mismatch is worth raising.
Common questions on this topic
Each of these is answered on its own page, in the first two sentences.
Sources
Diagnostic thresholds, target ranges and treatment guidance in this article are drawn from the following:
- The A1C Test & Diabetes — National Institute of Diabetes and Digestive and Kidney Diseases
- Standards of Care in Diabetes — American Diabetes Association
- Classification of diabetes mellitus — World Health Organization
- National Diabetes Statistics Report — Centers for Disease Control and Prevention
Keep reading
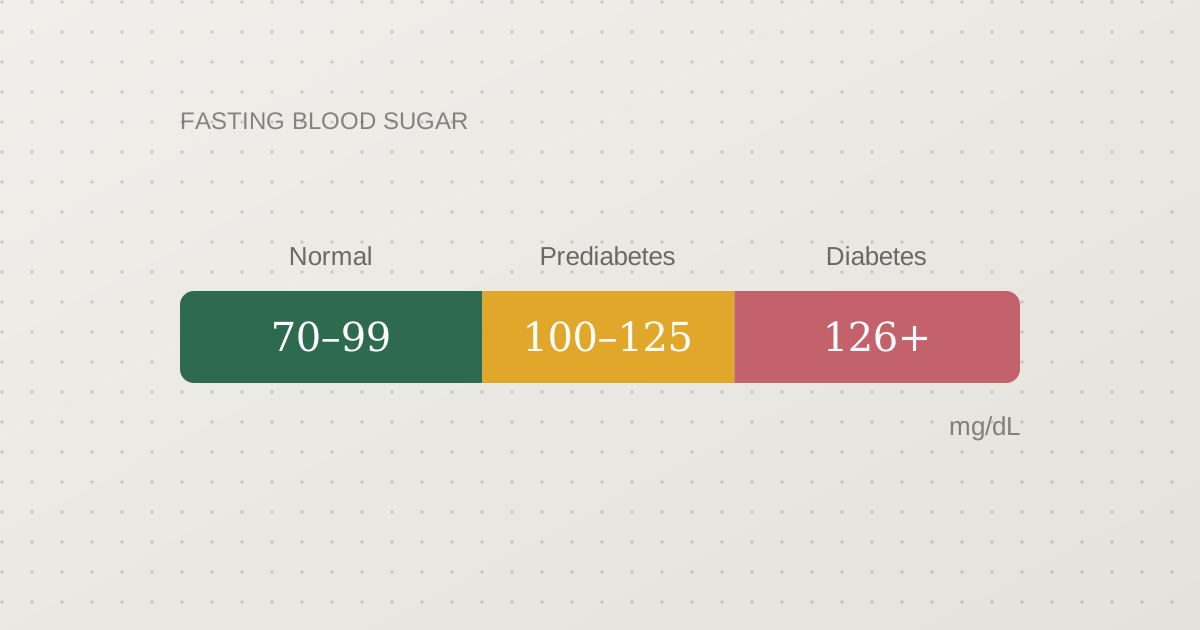
Normal Blood Sugar Levels Chart: Fasting, After Eating & A1c
One number rarely means much on its own. Here is what normal looks like fasting, two hours after eating and on an A1c test — and where the thresholds for prediabetes and diabetes actually sit.
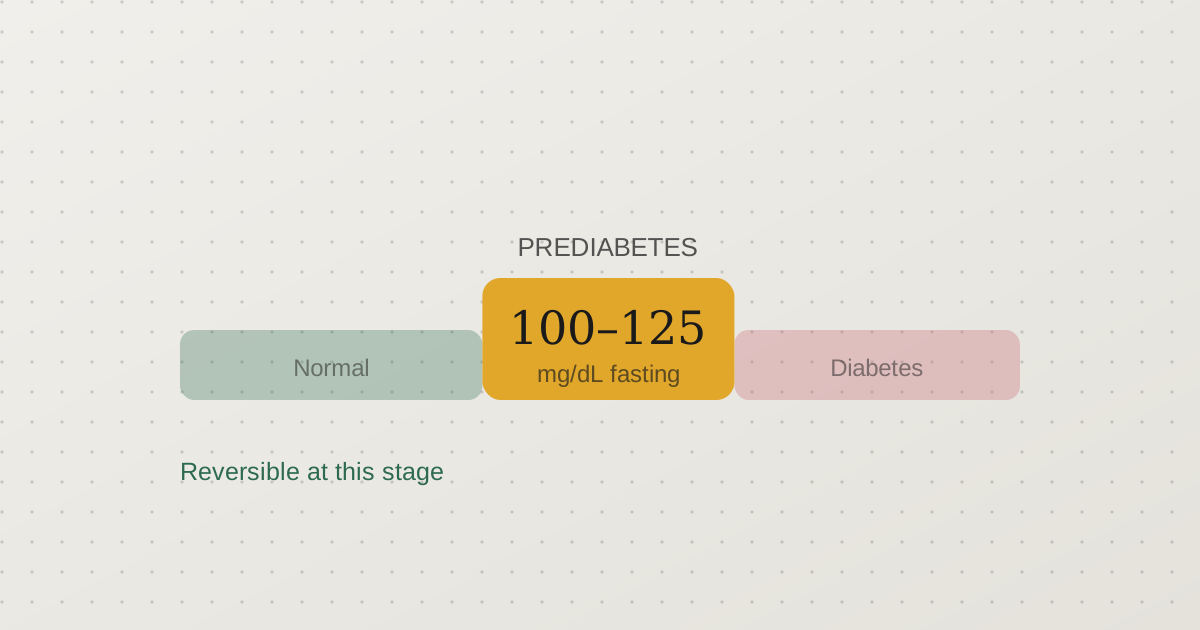
Prediabetes Symptoms: The Signs Most People Never Notice
The honest headline is that prediabetes usually causes nothing. Roughly 1 in 3 US adults has it and around 8 in 10 of them do not know. Here is what does show up, and who should be tested regardless.
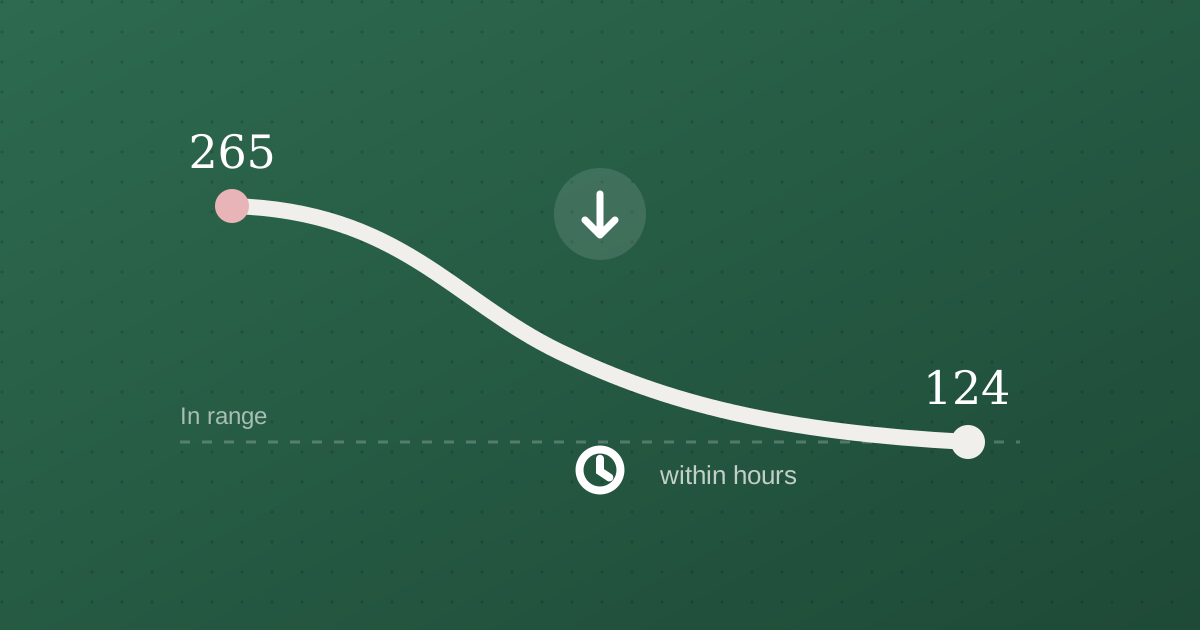
How to Lower Blood Sugar Quickly: 8 Evidence-Based Methods
Some things move glucose within the hour. Others take months but change the baseline. Here's what the evidence supports for each, and the point where self-management stops and medical help starts.