13 in-depth guides on symptoms, levels, causes and management. Each one is written to answer a single question properly, and reviewed against current clinical guidance.
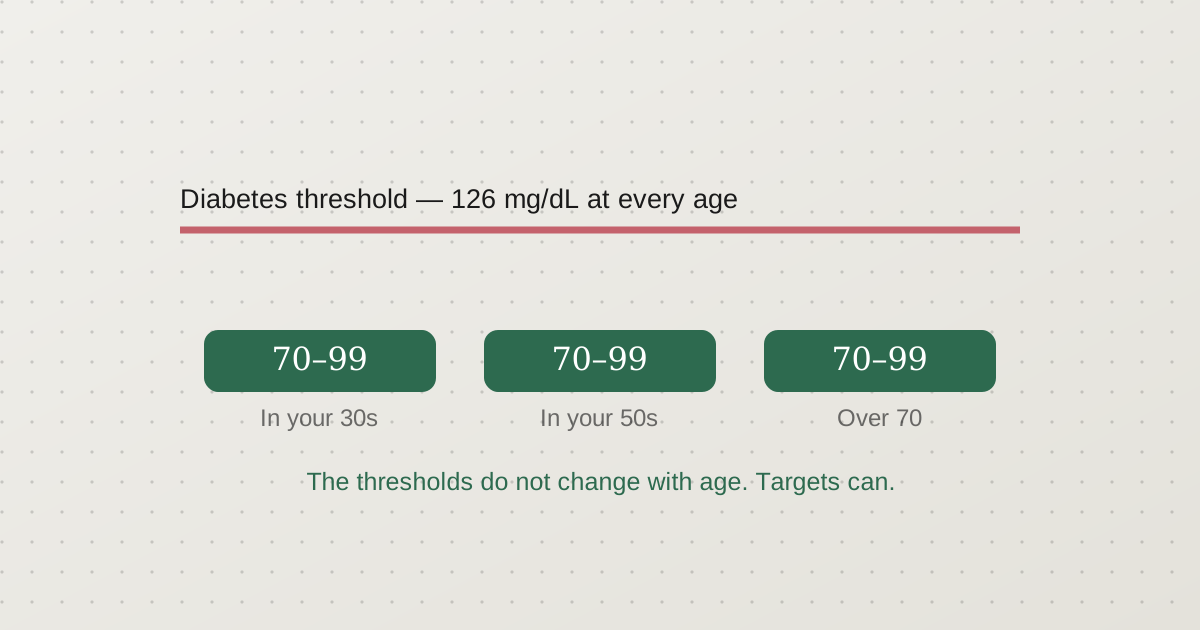
Most by-age charts are misleading. The thresholds are identical for every adult; what legitimately loosens with age is the target you are given once diagnosed, and the reason is hypoglycemia risk.
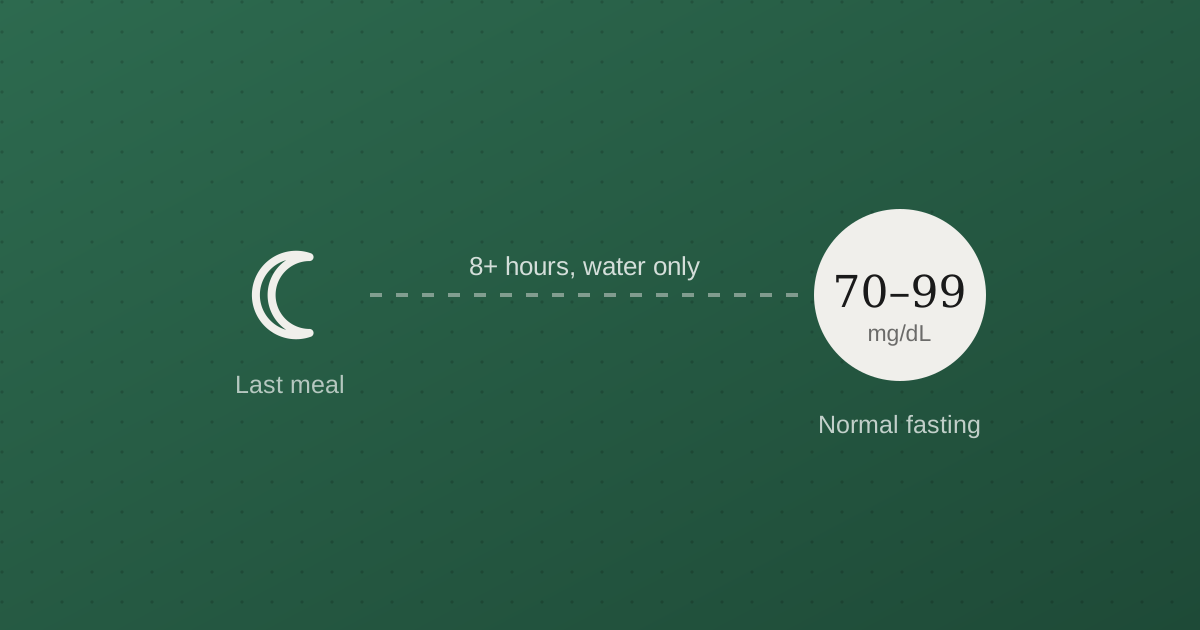
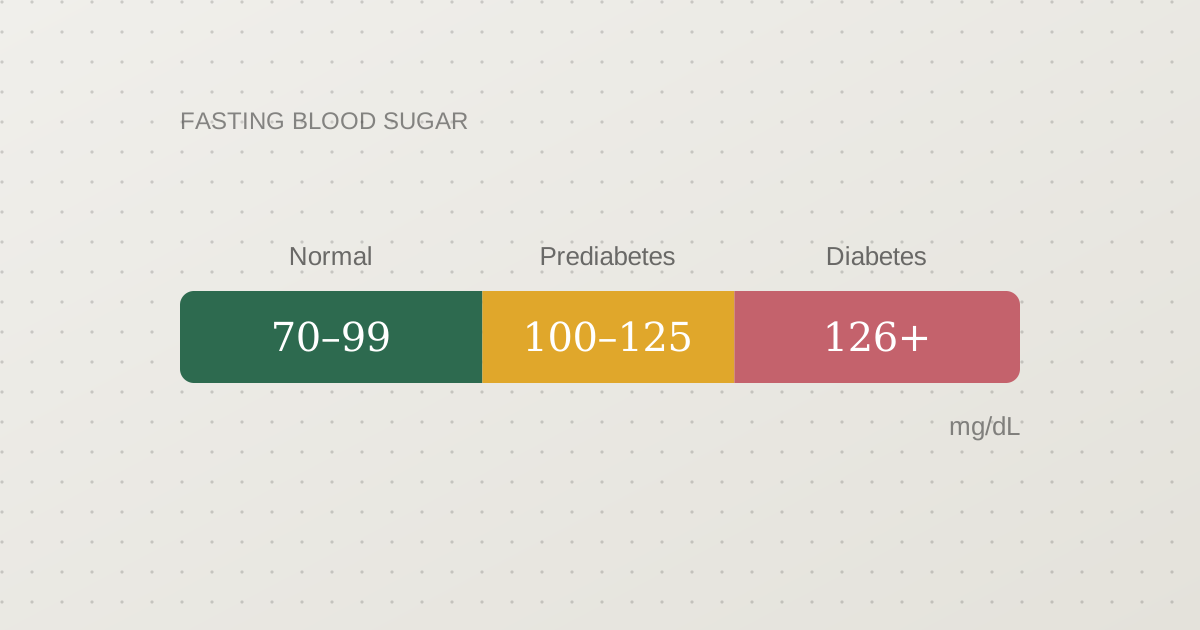
Normal is 70 to 99 mg/dL, prediabetes starts at 100 and diabetes at 126. But the number is only as good as the fast behind it — and morning readings mislead more often than any other measurement.
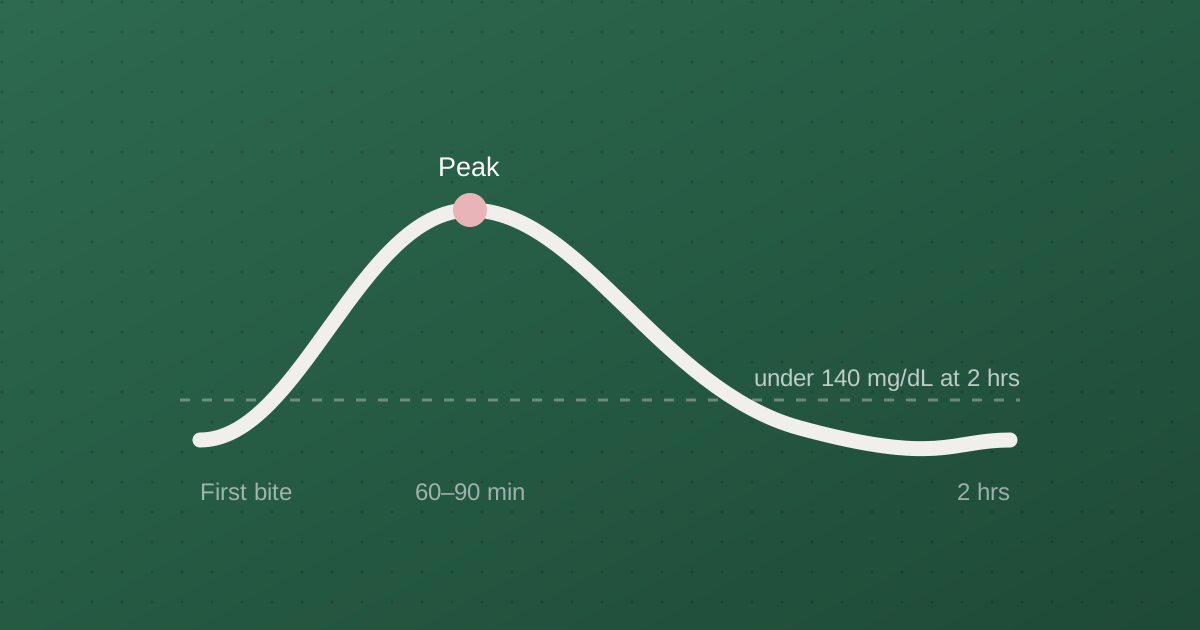
Glucose peaks 60 to 90 minutes after the first bite and should be under 140 mg/dL by two hours. Post-meal numbers go wrong before fasting ones do, which is why a normal fasting test can miss the problem entirely.
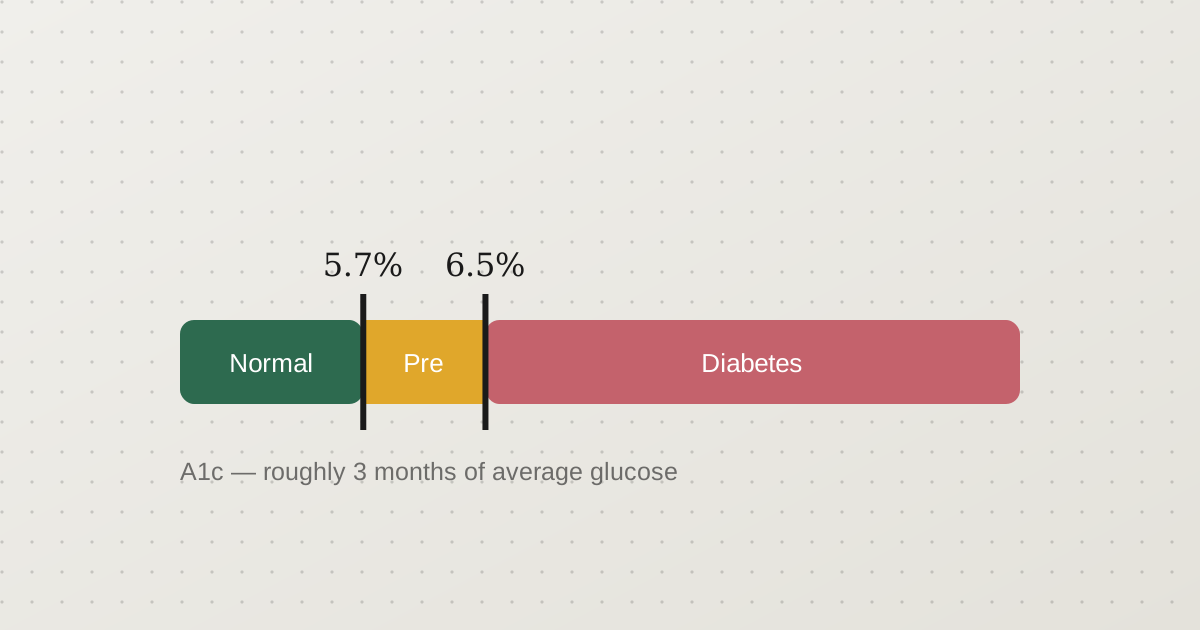
Below 5.7% is normal, 6.5% is the diabetes threshold, and under 7% is the usual target once you have a diagnosis. Here is the full chart, and the four situations where A1c misleads.
One number rarely means much on its own. Here is what normal looks like fasting, two hours after eating and on an A1c test — and where the thresholds for prediabetes and diabetes actually sit.