Blood Sugar After Eating: Postprandial Levels and Spikes Explained
Glucose peaks 60 to 90 minutes after the first bite and should be under 140 mg/dL by two hours. Post-meal numbers go wrong before fasting ones do, which is why a normal fasting test can miss the problem entirely.
Written from lived experience, not clinical training, and checked against the clinical guidance listed below. Not yet reviewed by a named clinician.
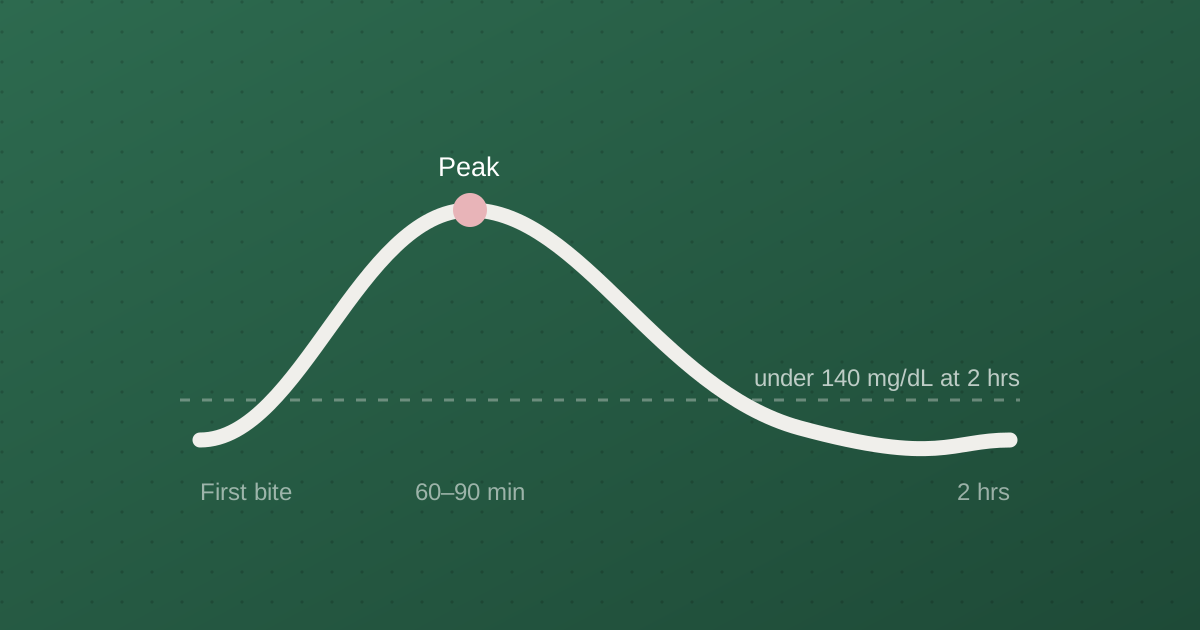
Everyone's blood sugar rises after eating. That is not a malfunction — it is the point. What distinguishes normal from not is how high the rise goes and how quickly it comes back down.
Post-meal glucose is also the measurement that goes wrong first, which makes it more useful for catching problems early than the fasting test most people are given.
The numbers
| Two hours after the first bite | Category |
|---|---|
| Below 140 mg/dL (7.8 mmol/L) | Normal |
| 140–199 mg/dL (7.8–11.0 mmol/L) | Impaired glucose tolerance (prediabetes) |
| 200 mg/dL (11.1 mmol/L) or above | Diabetes range |
| Below 180 mg/dL (10.0 mmol/L) at the peak | General target with diabetes |
Time from the first bite, not from when you finished. That is the convention the diagnostic thresholds are based on, and it is also the point where the two-hour oral glucose tolerance test takes its reading.
The shape of a normal curve
| Time from first bite | What is happening |
|---|---|
| 15–30 min | Glucose begins rising |
| 60–90 min | Peak |
| 2 hours | Clearly falling; under 140 mg/dL |
| 2–3 hours | Back near baseline |
With insulin resistance or diabetes the shape changes in three ways: the peak is higher, it arrives later, and the descent is slower. Four hours or more to return is common.
This is why testing at the wrong moment causes so much unnecessary alarm. A reading at 60 minutes is the peak, not a failure — comparing it against a two-hour threshold makes a normal result look alarming.
Why post-meal numbers fail first
Insulin release happens in two phases. The first phase is a rapid burst of stored insulin within minutes of eating, designed to meet the incoming glucose. The second phase is slower and sustained.
In the progression toward type 2 diabetes, the first phase is lost early — often years before fasting glucose moves at all. The overnight machinery still works, so the fasting test comes back fine.
The practical consequence is significant: someone can have a fasting glucose of 92 mg/dL and be spiking to 190 after lunch. A fasting test alone would call that normal and send them away.
If you have symptoms and a normal fasting result, ask for an A1c or a two-hour value before concluding nothing is wrong. Our guide to fasting blood sugar levels covers what that test does and does not see.
Postprandial versus fasting: what each tells you
They measure genuinely different things and can fail independently.
Fasting glucose reflects overnight liver output and how well insulin restrains it. It is the baseline machinery.
Postprandial glucose reflects how well you handle an incoming load — first-phase insulin, gastric emptying, and muscle uptake.
Some people have impaired fasting glucose with normal post-meal handling. Others have the reverse. Both sit under the prediabetes label despite being different physiological problems, which is one reason two people with the same diagnosis can need quite different advice.
There is also evidence that post-meal peaks contribute disproportionately to cardiovascular risk and to A1c at lower A1c levels — when the average is close to target, it is usually the peaks that are keeping it from being closer.
What changes the size of a spike
Carbohydrate type. Liquid sugar is fastest — juice reaches the bloodstream almost as quickly as glucose syrup. Whole intact grains and legumes are slowest. Grinding grain into flour destroys the structure that slows digestion, which is why whole oats and instant oat cereal produce very different curves from similar carbohydrate.
Portion. More carbohydrate means both a higher peak and a longer return.
What it is eaten with. Protein, fat and fibre alongside carbohydrate flatten the curve substantially.
The order. Vegetables and protein before the carbohydrate portion produces a markedly lower peak than the same food eaten in reverse. This is one of the most reliable findings in the area.
Time of day. Insulin sensitivity is generally lowest in the morning, so an identical breakfast produces a higher peak than the same food at lunch.
Movement. A walk afterwards shortens and flattens the curve. Sitting extends it.
Fat content. A fatty meal — pizza, a rich curry — slows gastric emptying, producing a lower early peak but a much longer tail. The two-hour reading looks fine while glucose is still elevated at four or five hours. This catches people out regularly.
Sleep and stress. Both reduce insulin sensitivity, so the same meal behaves worse after a short night or a hard day.
How to flatten a spike
Three changes, in order of reliability:
- Sequence the meal. Vegetables and protein first, carbohydrate last. Free, immediate, no willpower required.
- Never eat carbohydrate alone. Fruit with nuts, bread with olive oil, rice with a real protein portion.
- Walk 10 to 20 minutes afterwards, starting within half an hour. Contracting muscle takes up glucose without needing insulin, which is why this works even when insulin resistance is high.
Beyond those: displace liquid sugar entirely, choose intact grains over flour, and add fibre. Our guide to lowering blood sugar covers what the evidence supports and what it does not.
When to test, if you are testing
If you are trying to learn how your own body responds rather than following a clinical protocol, the useful pairing is before the meal and at two hours. The difference between the two is more informative than either number alone.
Testing at one hour tells you about the peak, which is interesting but has no widely agreed threshold outside pregnancy. If you use a continuous glucose monitor you get the whole curve, which is considerably more useful than either point.
Test one meal at a time and change one thing. Comparing your usual lunch against the same lunch with the order reversed teaches you more than a fortnight of scattered readings.
The reactive low that follows a big spike
A pattern worth naming, because people find it alarming and it is often misread.
Some people — with and without diabetes — get symptomatic lows two to four hours after a large carbohydrate-heavy meal. The sequence is a steep rise, an overshoot of insulin release, and a drop below where they started. It feels like shakiness, sweating, anxiety and hunger, and it resolves on eating.
In people without diabetes this is sometimes called reactive hypoglycemia. It is a sign of an exaggerated glucose swing rather than of low blood sugar as a disease, and the fix is the same as for the spike: flatten the rise and the overshoot follows it down.
If it happens repeatedly, it is worth testing during an episode rather than assuming — genuinely low readings below 70 mg/dL warrant a proper evaluation.
Why the same meal behaves differently on different days
People often conclude their meter is broken when an identical meal produces readings 40 mg/dL apart. It usually is not.
The same food genuinely produces different curves depending on how much you slept, what you did beforehand, how stressed you are, where you are in your menstrual cycle, whether you are fighting off an infection, and what you ate at the previous meal — the so-called second-meal effect, where a high-fibre breakfast measurably improves the response to lunch.
Individual variation between people is larger still. Studies giving identical meals to many participants find substantially different glucose responses to the same food, which is why a food that spikes one person can be unremarkable for another.
The practical reading: your own readings are more informative than any glycemic index table, and one measurement of a meal is not enough to judge it.
What to do with a high result
A single reading above 140 mg/dL at two hours after an unusually large or carbohydrate-heavy meal is not a diagnosis and not worth losing sleep over.
A repeated pattern is worth investigating. Ask for a fasting glucose and an A1c, and mention the post-meal readings specifically — they are the reason to consider a two-hour glucose tolerance test, which is the most sensitive of the three.
Readings of 200 mg/dL or above after eating are in the diabetes range and should be discussed with a doctor. The full blood sugar levels chart covers every test and threshold in one place, including the readings that need same-day care.
Frequently asked questions
What is a normal blood sugar after eating?
Below 140 mg/dL (7.8 mmol/L) two hours after the first bite, for someone without diabetes. From 140 to 199 mg/dL indicates impaired glucose tolerance, and 200 mg/dL or above is in the diabetes range. Most adults with diabetes are given a target below 180 mg/dL at the peak.
When does blood sugar peak after a meal?
Around 60 to 90 minutes after the first bite in most people. With insulin resistance or diabetes the peak is higher and arrives later, and a fatty meal can delay it substantially — sometimes leaving glucose elevated four or five hours later.
Is a blood sugar spike after eating normal?
A rise after eating is entirely normal and expected. What matters is how high it goes and how quickly it comes back. Peaking under 140 mg/dL and returning to baseline within two to three hours is normal; peaking over 180 or still being elevated at four hours is not.
What is the difference between postprandial and fasting glucose?
Fasting glucose measures overnight liver output and how well insulin restrains it. Postprandial glucose measures how well your body handles a meal, particularly the quick first-phase insulin release. They can fail independently — a normal fasting result does not rule out a post-meal problem.
How do I stop blood sugar spiking after meals?
Eat vegetables and protein before the carbohydrate portion, never eat carbohydrate on its own, and walk for 10 to 20 minutes afterwards. Those three change the shape of the curve more reliably than anything else you can do without medication.
Common questions on this topic
Each of these is answered on its own page, in the first two sentences.
Sources
Diagnostic thresholds, target ranges and treatment guidance in this article are drawn from the following:
- Standards of Care in Diabetes — American Diabetes Association
- Classification of diabetes mellitus — World Health Organization
- National Diabetes Statistics Report — Centers for Disease Control and Prevention
- The A1C Test & Diabetes — National Institute of Diabetes and Digestive and Kidney Diseases
Keep reading
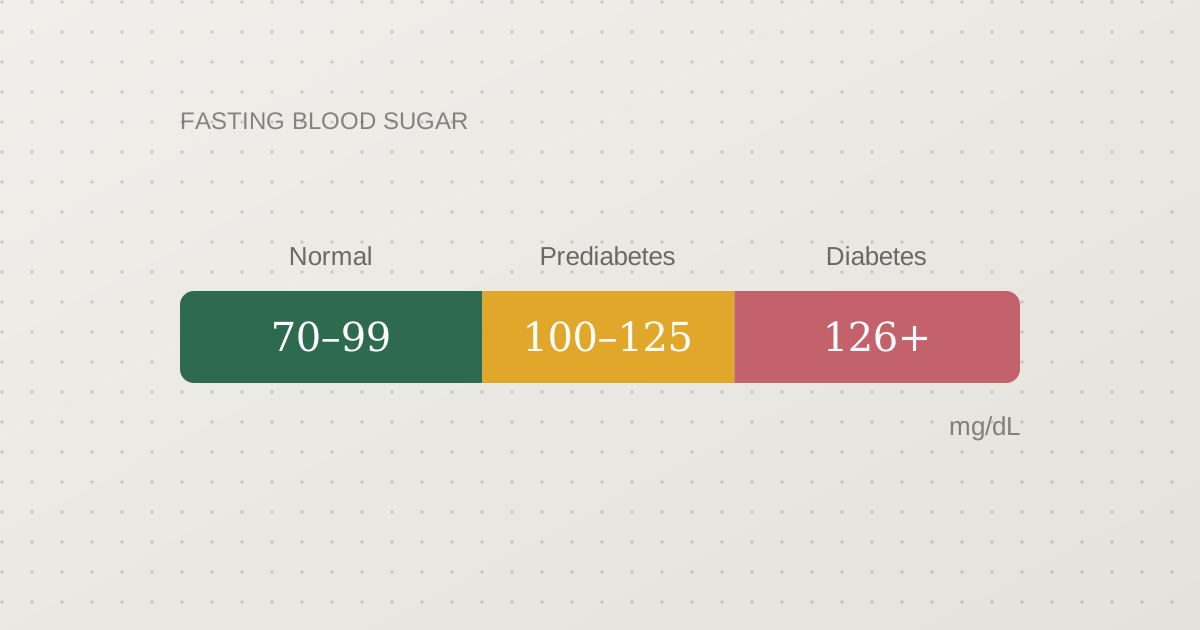
Normal Blood Sugar Levels Chart: Fasting, After Eating & A1c
One number rarely means much on its own. Here is what normal looks like fasting, two hours after eating and on an A1c test — and where the thresholds for prediabetes and diabetes actually sit.
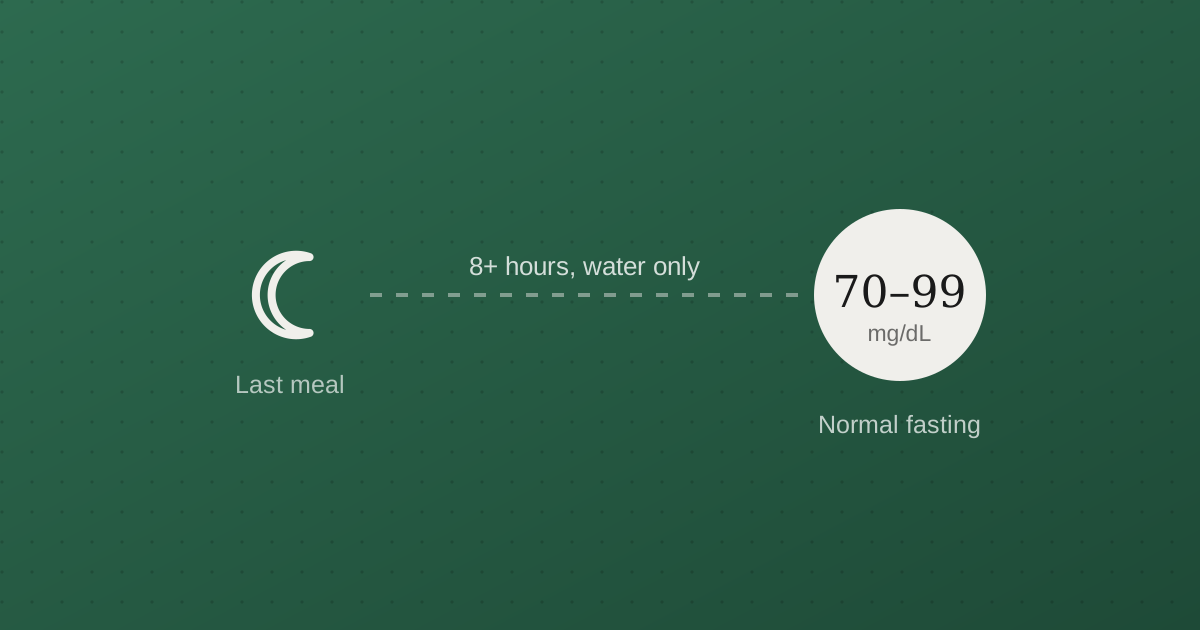
Fasting Blood Sugar Levels: Normal Range and What Yours Means
Normal is 70 to 99 mg/dL, prediabetes starts at 100 and diabetes at 126. But the number is only as good as the fast behind it — and morning readings mislead more often than any other measurement.
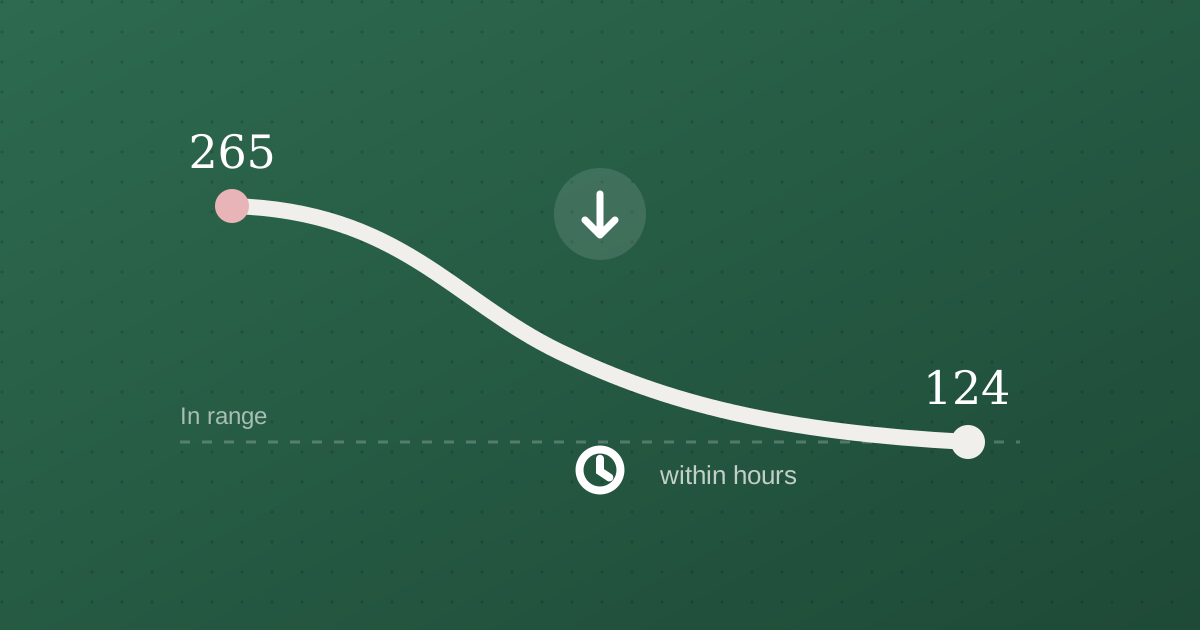
How to Lower Blood Sugar Quickly: 8 Evidence-Based Methods
Some things move glucose within the hour. Others take months but change the baseline. Here's what the evidence supports for each, and the point where self-management stops and medical help starts.